Welcome!
I'm a post-doc researcher in heterogeneous catalysis in the Catalan Institute for Chemical Research (Tarragona, Spain).
On this website, I put some information about my research experience, my teaching experience as well as my education and skills.
I would like to write here an unofficial guide to use  , powerful tool which unfortunately lacks documentation.
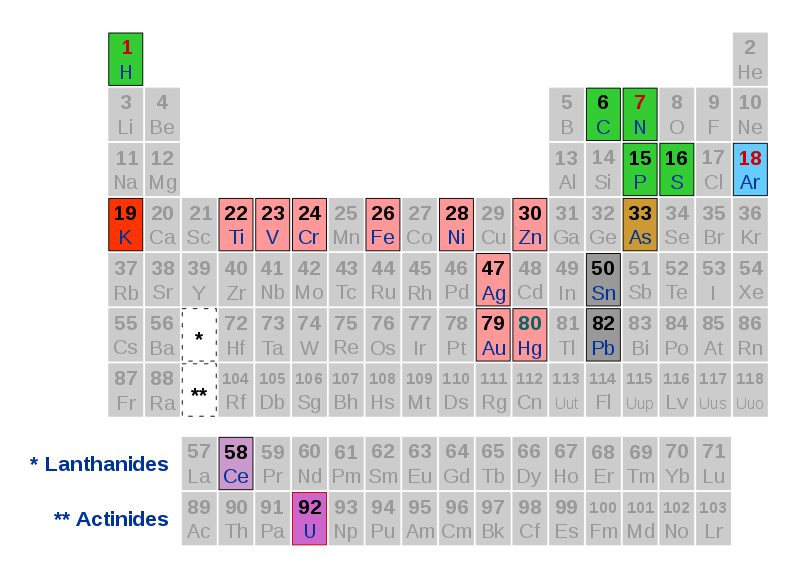
A wonderful chemistry and history book was written by Primo Levi called "The Periodic Table". In this book, the author, survivor of the Holocaust, classified his experiences as a chemist and in the rest of his life in chapters named after an element. The table of content of this book can therefore simply given as a periodic table:

To give a quick overview of my previous and actual research interests, as a chemist, I find it interesting to use the same system. Maëlle Salmon, my wife, who is very skilled with the statistical and visualization language "R", did a nice visualization of tiny stories about my interactions as a chemist with these elements. I used some of them "in real life" as an experimental chemist, but I have interacted with others only through a computer as a theoretician. Some are only part of stories I told in the guided tour I gave about the life of Marie Curie. The colors depend on the places where I used them.
Lanthanides and actinides are not presented in this classification, because I never used them in my research. Some might argue that those are only for "physicists playing chemistry"!
Of course, in my daily life and during my education, I have used a lot of other elements (at least because I need iron to fix oxygen and transfer it in my body!) but I only present here elements meaningful in my research.
If you are interested by such a map, Maëlle has written an article in her blog describing how to draw a periodic classification and make it interactive.
She also did with the same software a visualization of the places where I have studied and worked as a researcher: