p4vasp
Why this guide

P4Vasp is one of the Graphical User Interface to visualise spacial arrangements of atoms from their geometrical coordinates. Using directly the output files generated by the first principle modelling package VASP, this software is rather popular. Unfortunately, the documentation about this software is very limited on the webpage of the creators.
Based on my own use of this software, I want to make a small unofficial documentation.
Some known issues
Presence of a .xml files in the current folder directory
By default, p4vasp will look for .xml files when it starts, for instance vasprun.xml files that will be automatically read.
If your current folder directory contains .xml files not related to Vasp, it may generate various error messages. Remove those files and it should behave better.
DOS Plot
For the atom or orbital projected spin density, the minority density (negative values) can be displayed as positive values. This can be confusing for visualization of several atoms. The solution in this case is to export the data and use other software to get the right representation.
Velocity Autocorrelation Function (VAC)
One of the most powerful tool in P4Vasp is the possibility to calculate the autocorrelation of all the velocities in a system just with a few clicks. For molecular dynamics results, this autocorrelation can be usefull, especially for Infra-Red measurements. Here is how to use it:
-
Firstly, the autocorrelation can be obtained only from the vasprun.xml file resulting for a finished calculation. If your molecular dynamics was aborted before reaching its last step, then you have to modify the end of your vasprun.xml file. Here is a little tool written in Python 2.7 to get a proper termination for files recovered from unfinished run.
-
Once the file is loaded, you can look at the evolution of the system in time (see part …) and also choose the “VAC” option in the “MD” menu.
-
Then, the autocorrelation can be calculated for all the atoms simply with the “Read VAC” button.
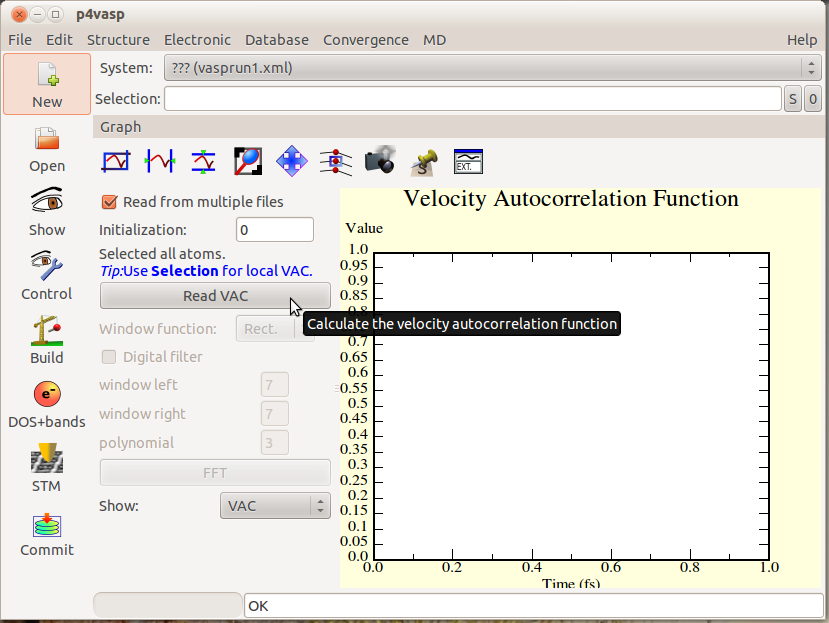
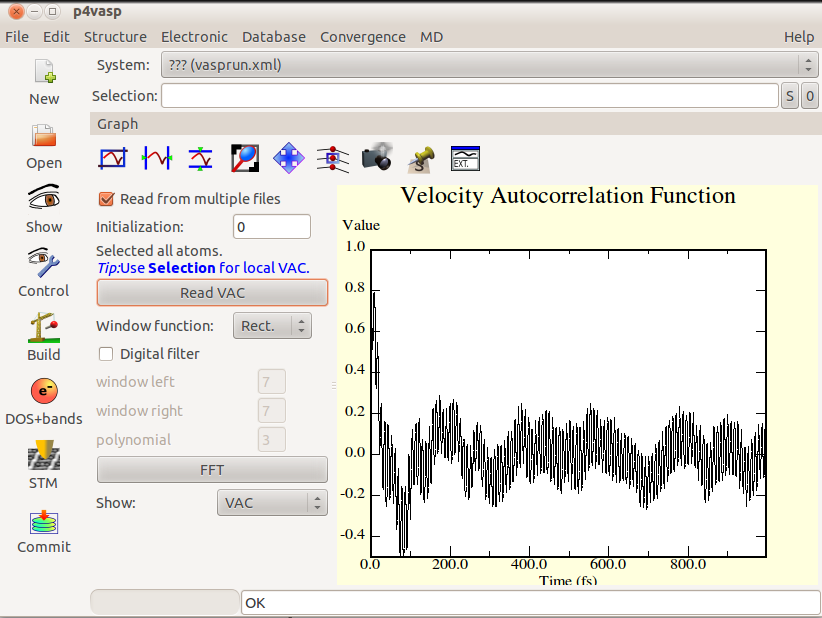
- For a molecular dynamics with N steps, the autocorrelation will be calculated with N-2 positions. Here is a molecular dynamics over 1000 steps.
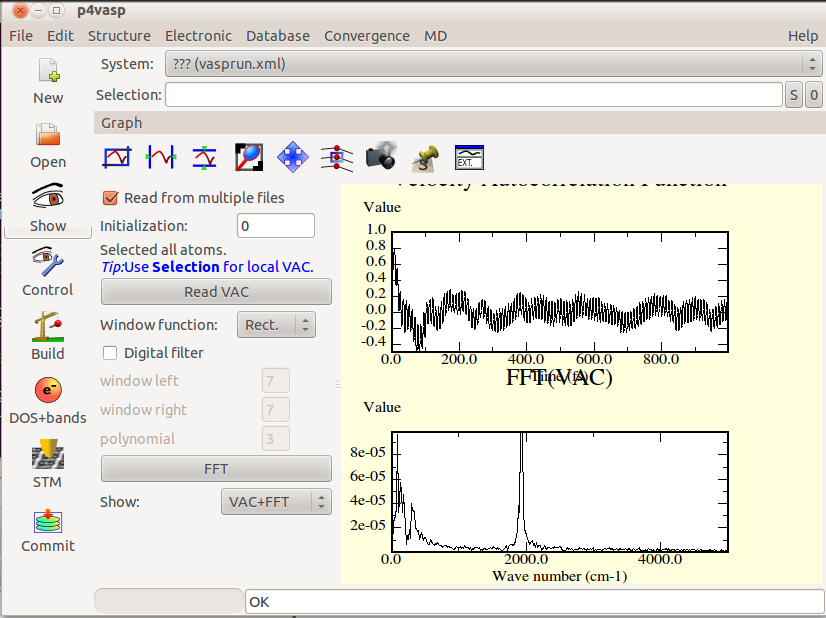
- The Fourier Transformation can be obtained by the “FFT” button and will display useful information about the frequencies existing in the system.
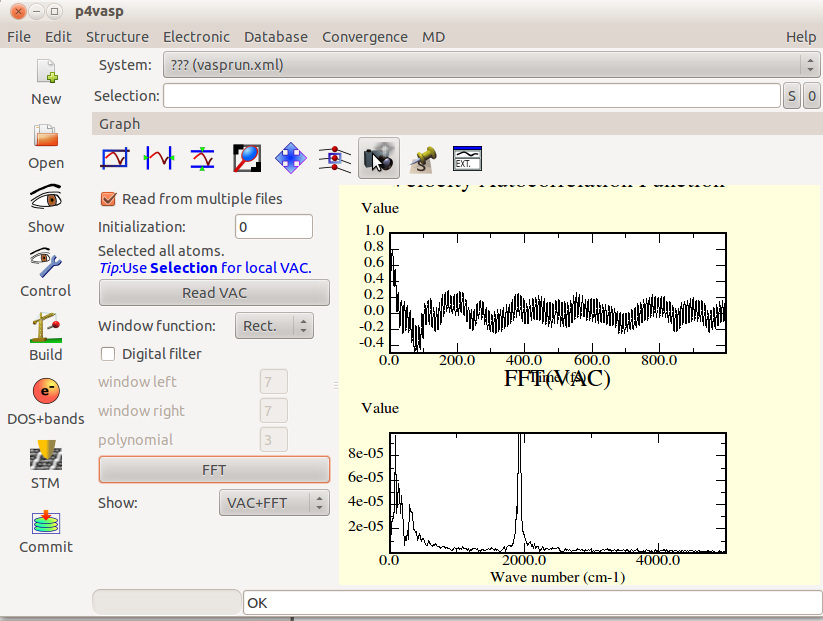
- To get the data in a usable form, the photo camera button will three files, a postscript picture, a dat file with the data and a file with a .agr extension describing the graph.
Rotate around one bond with p4vasp
Rotation around the axe of a bond.
It is possible to perform a rotation around the axe of a bond with p4vasp which preserve all the lengths for the bonds within the molecules. It can be realized in several steps.
- Open the file containing the geometrical informations.
- Visualize it with the “Show” icon.
- Select, within the “Edit” menu, “Rotate atoms”
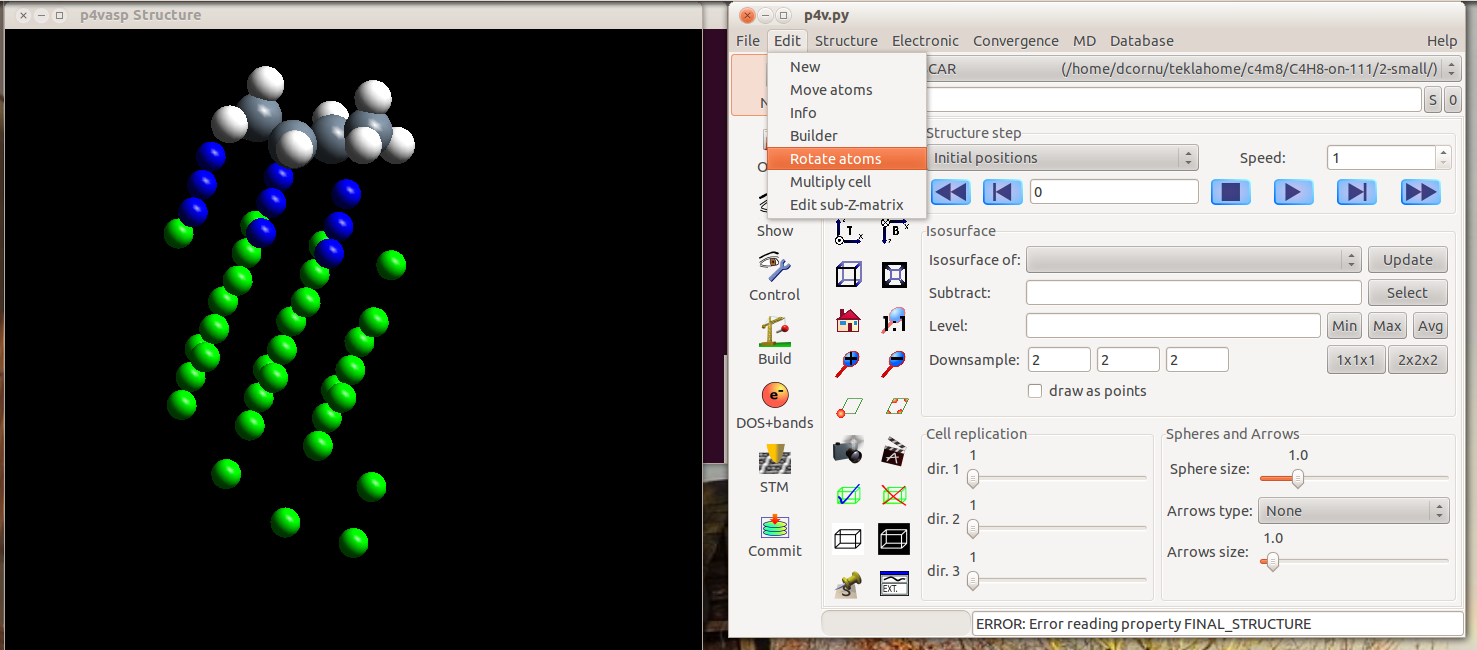
- Select the atom that will remain fixed during the rotation. Here, the carbon on the right side of the but-1-ene adsorbed molecule.
The selection is rather tricky in p4vasp. You have two possibilities: if you know the orders of your atomes in your input files, you can type it directly in the “Selection” part. But the simplest way is to use the graphical representation and press the space bar on the keyboard when the cursor is over the atom you want to select.
Once the atoms are selected, they appear striped.
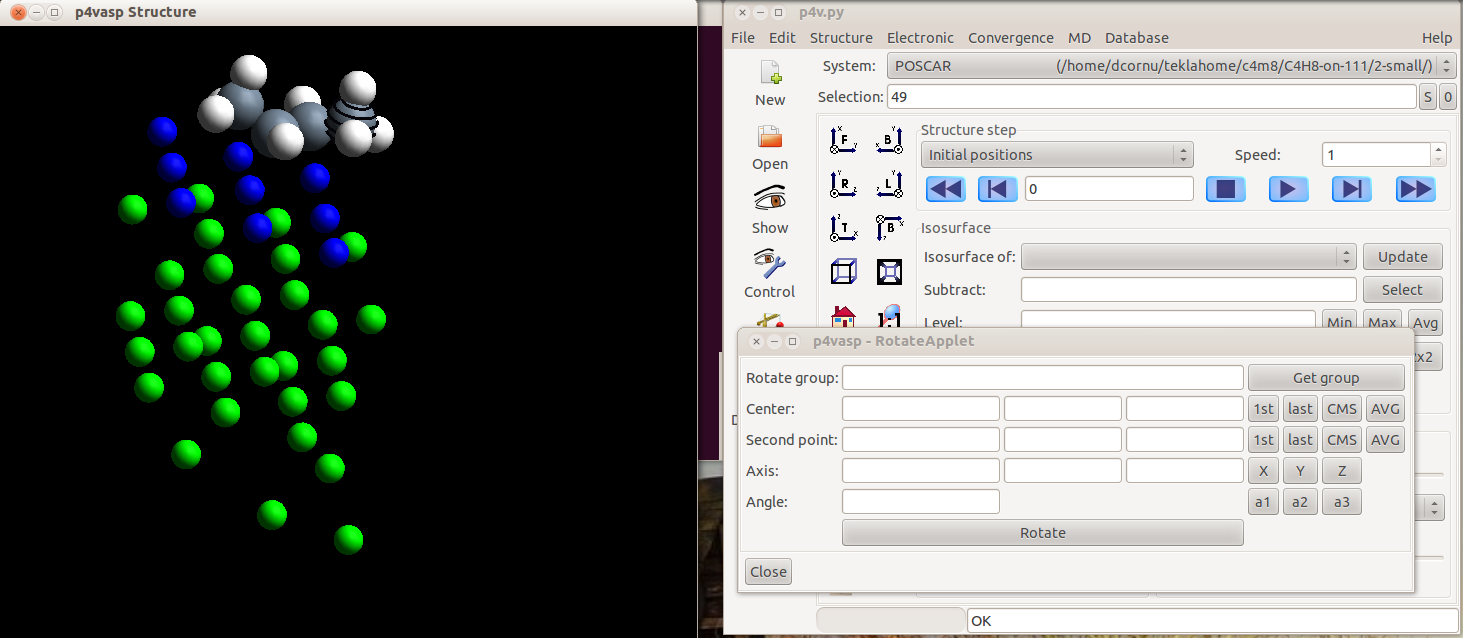
- Select then the other atoms. Here, a methyl group of an adsorbed alkene is selected.
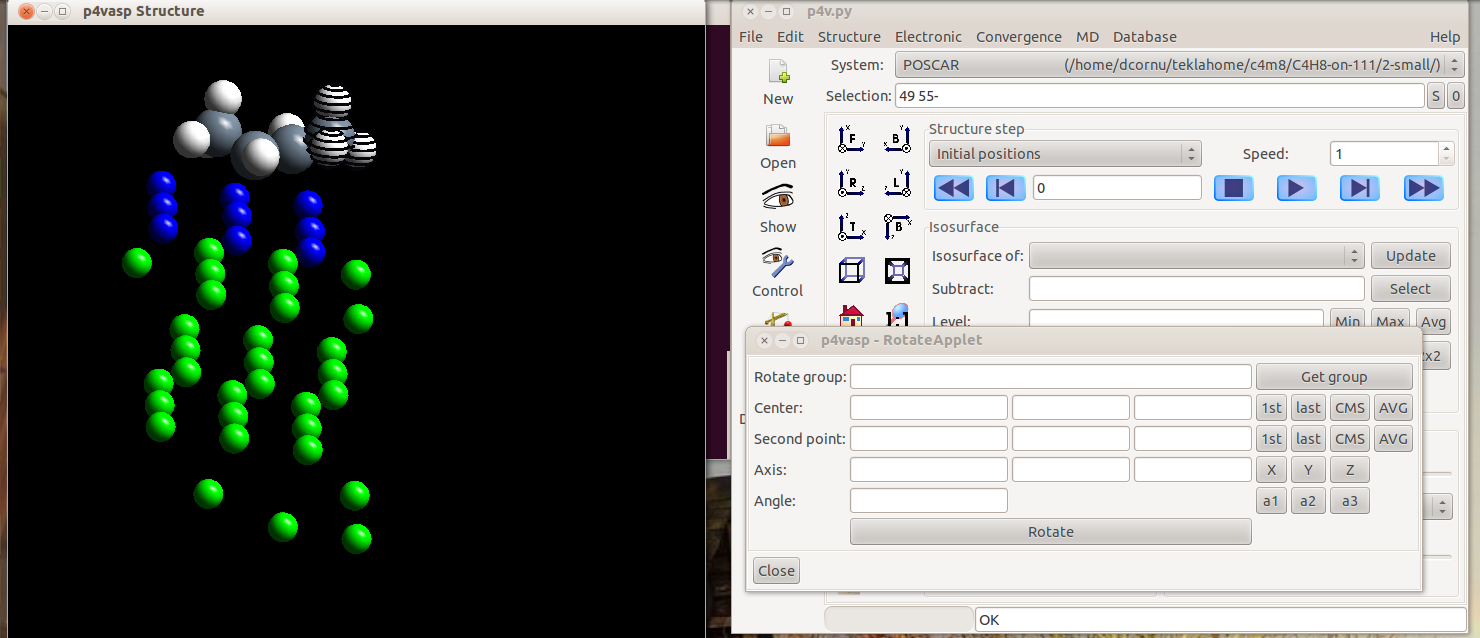
- Once all your atoms are selected, you can click on “Get group”. The center (the first atom you selected) and the group selected for rotation appear in the Applet.
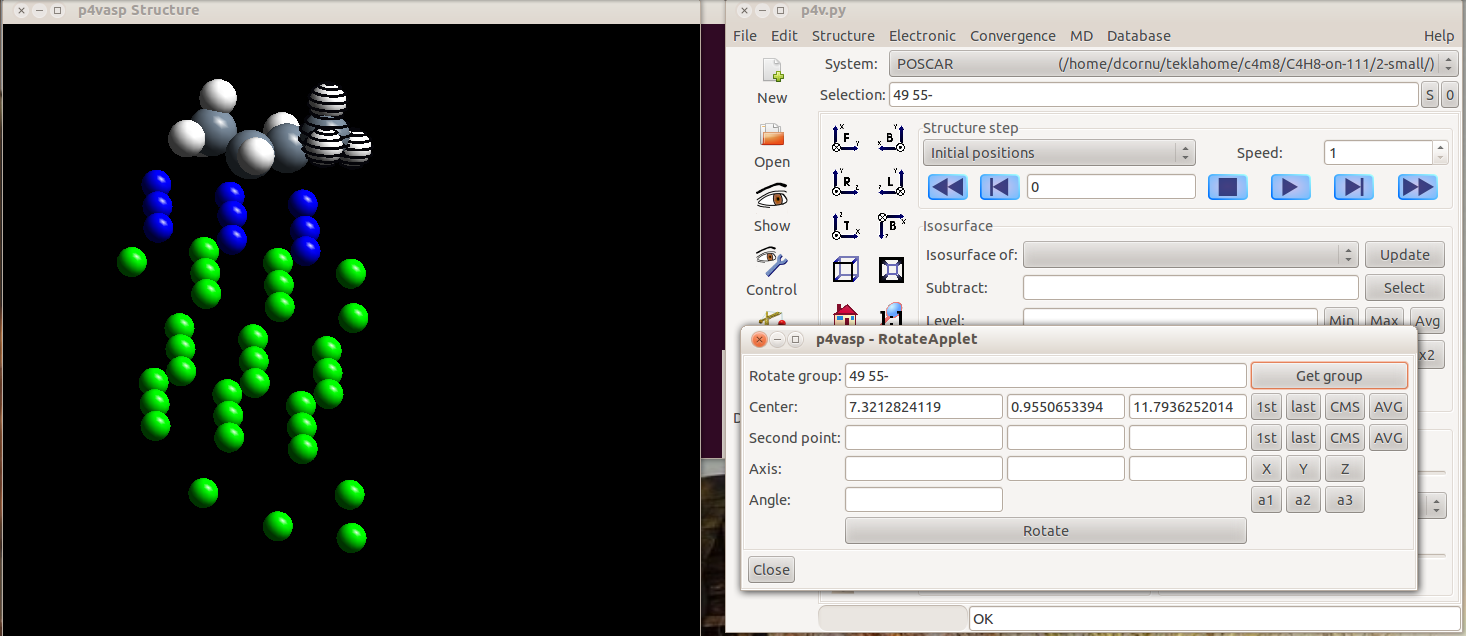
- Then, you have to select the second atom from the bond which define the axis of rotation. Select it as you selected the previous atoms. The axis vector will be computed automatically.
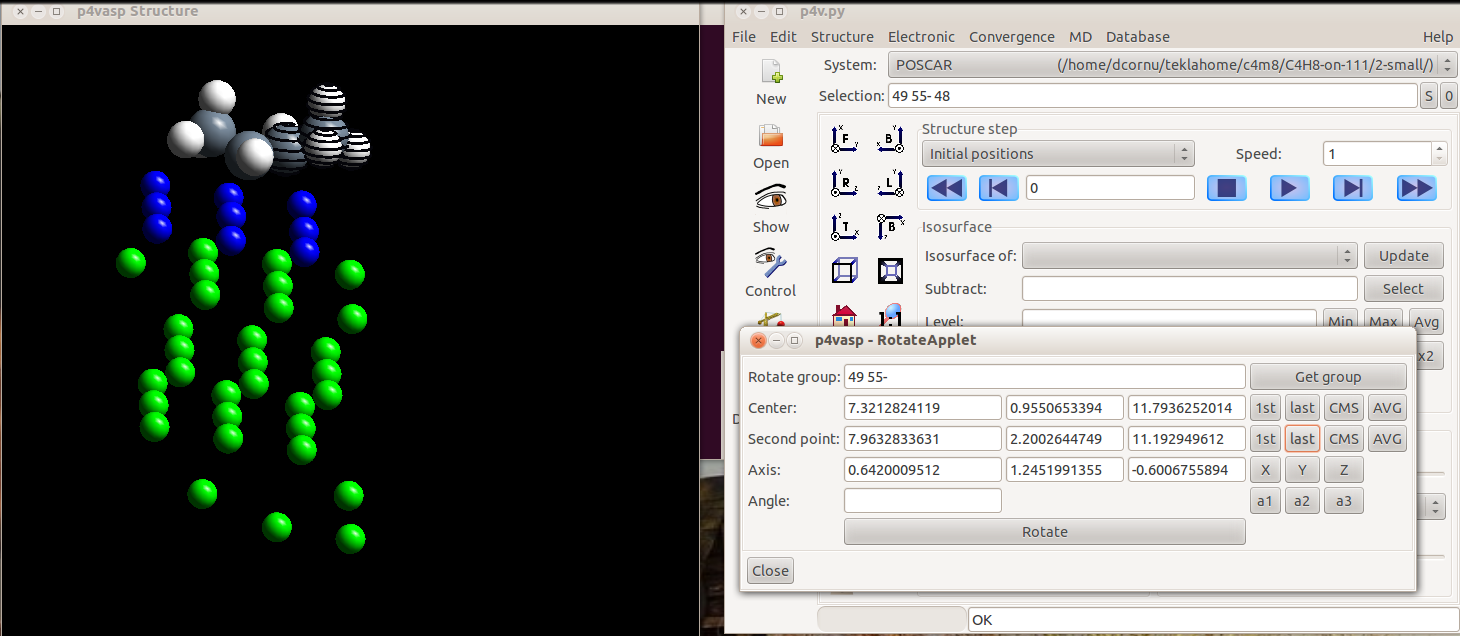
- The rest is straightforward: by typind and angle and clicking on “rotate”, you will generate a rotation of the atoms (here, the three hydrogen atoms selected) around the axe of the C-C bond.